Cadence
I Grafana!
I really enjoy how easy it is to build visualizations for practically anything using Grafana!
Cadence is an observability platform my team and I built, during my time as founder at The CNC Institute. We built it to monitor Oracle’s ERP Plartform JD Edwards. We wanted a single pane of glass insight into what JD Edwards and its supporting technolgies were doing, and to trend and visualize these metrics and data. It gave us unparalled insights into the perfromance and scalability of the load balancers, web tier, application tier and database tiers. Simply put, there is nothing else like it!
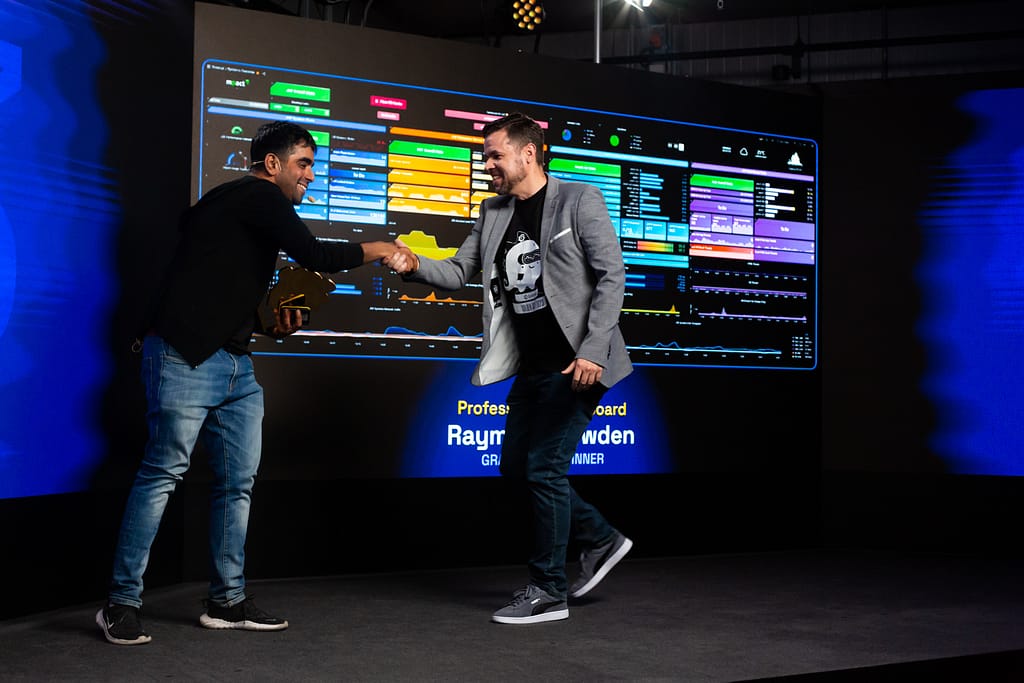
I was fortunate enough to be selected as the 2023 Grafana Golden Grot winner , for the professional category, in this years inaugural Grafana Golden Grot Awards, with Cadence, the best observability platform for JD Edwards.
You can view some of my dashboards here on Grafana’s actually free cloud platform:

“Our story of composability is big-tent: you can make your own choices for what data sources you want to use. And the data, of course, remains where you would like it to be.”
– RAJ DUTT
Other projects


Let’s work together on your
next web project
Lorem ipsum dolor sit amet, consectetur adipiscing elit. Ut elit tellus, luctus
nec ullamcorper mattis, pulvinar dapibus leo.